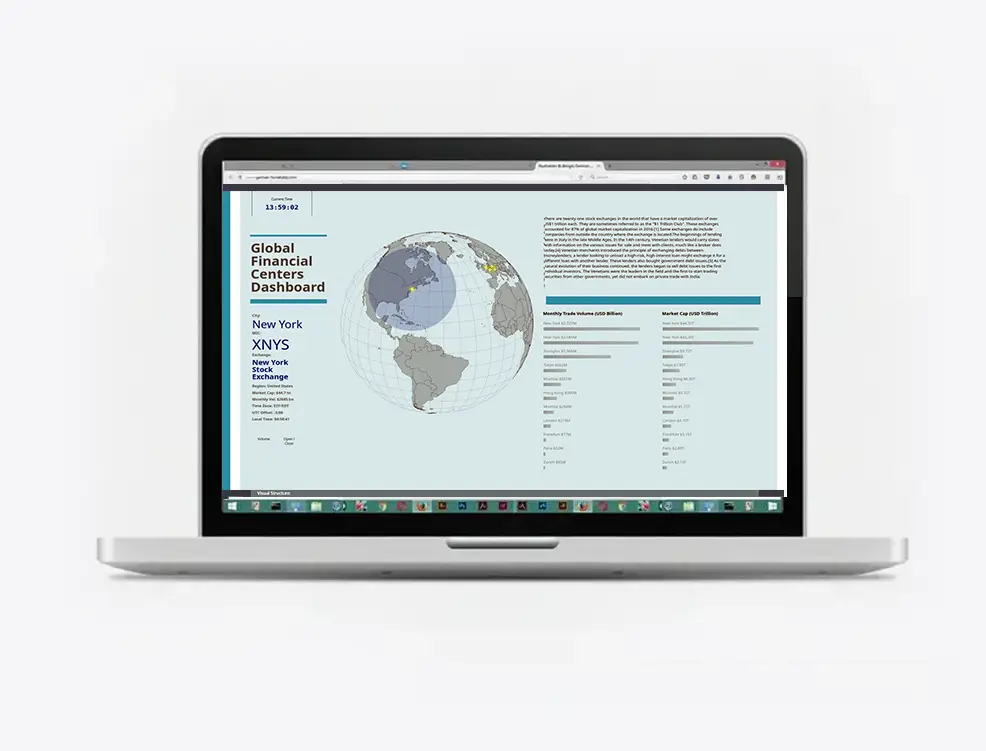
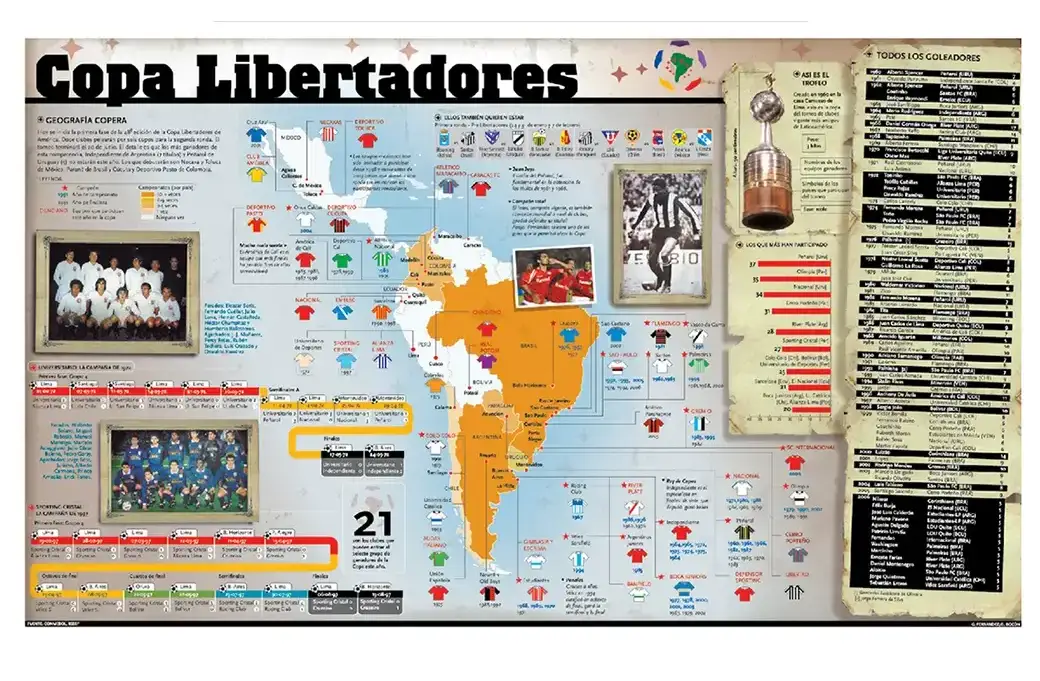
Information design / Data visualization

Editorial
Book Cover

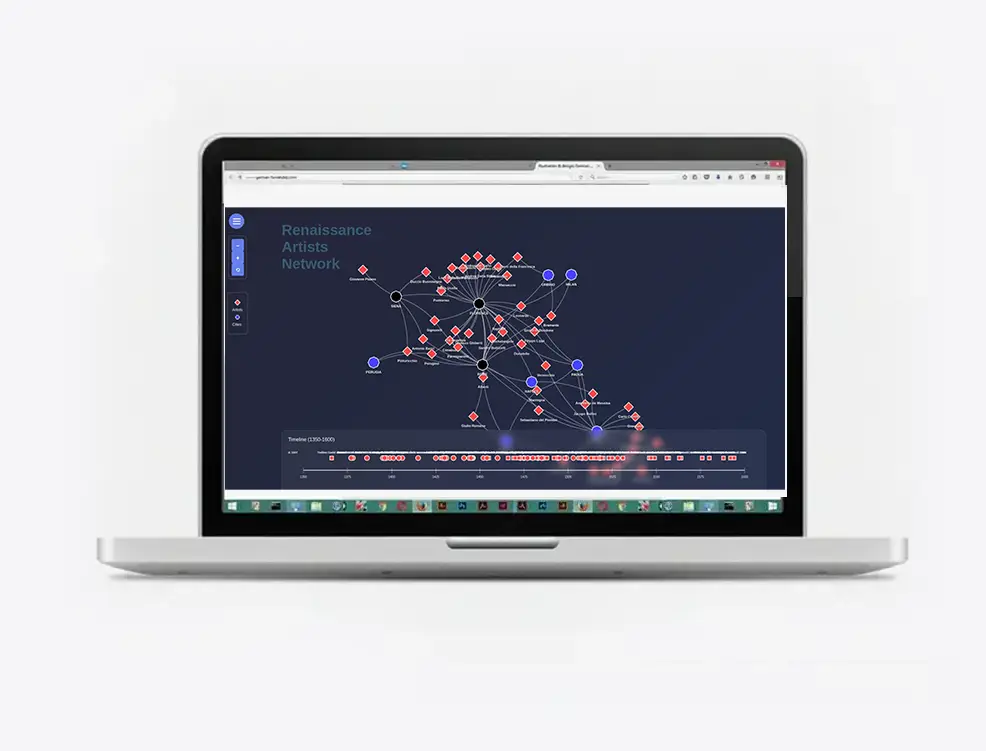
An interactive visualization exploring the people, places and ideas that shaped the Renaissance. The project translates historical information into a visual system that allows users to explore relationships, patterns and chronology.
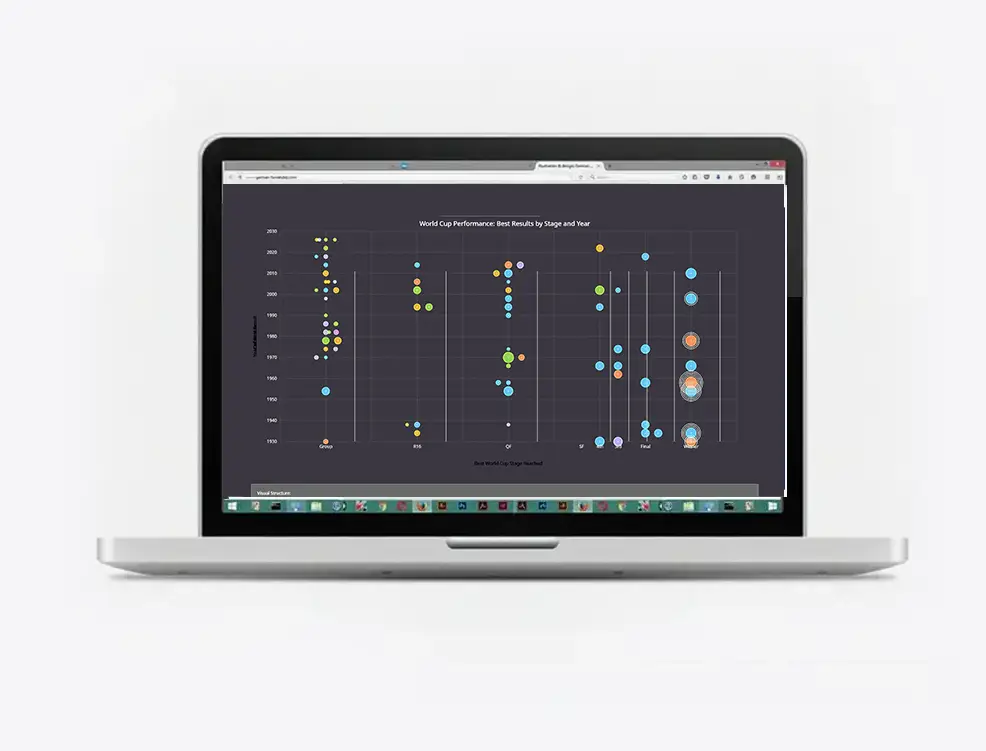
Project Editorial. Book Covers
Role Research / Design / Visualization
Discipline Information Design
Format Interactive / Digital
Renaissance dashboard visualization
01 / Context

A large amount of historical information needed a visual structure.

Historical subjects often contain a large number of people, dates, locations, movements and relationships. Presented as conventional text or isolated facts, those relationships can be difficult to perceive.

The objective of this project was to explore how historical information could be reorganized into a visual system that allows relationships and patterns to become visible.

02 / Problem

How can complex information become easier to explore?

The challenge was not simply to make the information attractive. The visualization needed to establish hierarchy, reduce cognitive friction and allow users to understand the information without being overwhelmed.

This required decisions about what information should be emphasized, how categories should relate to one another and how visual encoding could communicate differences without adding unnecessary decoration.

03 / Approach

From information to visual system.

01

Research

Organizing the source material and identifying the relevant variables, categories and relationships.

02

Structure

Establishing hierarchy and deciding how different types of information should interact within the system.

03

Visualize

Translating the structure into visual encodings, diagrams, typography and interactive elements.

04 / Solution

A visual interface for exploring the information.

The final system combines typography, color, scale, position and interaction to establish relationships between different pieces of information.

Rather than presenting the Renaissance as a single chronological narrative, the interface allows the information to be approached from different directions.

Renaissance visualization detail
Renaissance dashboard detail
Information visualization
05 / Result

Complex historical information becomes a visual environment that can be explored rather than simply read.

Explore

See the project in its interactive form.

The interactive version allows the visual system to be experienced as intended, rather than through static portfolio images.

Open interactive project →

Next project
FIFA World Cup →
Contact

Have something
complex to communicate?

I work with information graphics, data visualization, editorial design, illustration and digital experiences. If you have a project, publication, dataset or idea that needs to become clearer, let's talk.

design.gefercan@outlook.com